publications
Here you can browse my growing collection of publications.
Journal Papers
2026
- SOIL
 A GLUE-based assessment of WaTEM/SEDEM for simulating soil erosion, transport, and deposition in soil conservation optimised agricultural watershedsK. D. Seufferheld, P. V. G. Batista, H. Shokati, and 2 more authorsSOIL, 2026
Soil erosion models are important tools for soil conservation planning. Although these models are generally well-tested against plot and field data for in-field soil management, challenges arise when scaling up to the landscape level, where sediment trapping along landscape features becomes increasingly critical. At this scale, a separate analysis of model performance for representing erosion, sediment transport, and deposition processes is both challenging and often lacking. Here, we assessed the capacity of the spatially distributed erosion and sediment transport model WaTEM/SEDEM to simulate sediment yields in six highly instrumented micro-scale watersheds ranging from 0.8–7.8 ha, monitored over eight years from 1994–2001, in Southern Germany. The watersheds were composed of two groups: four field-dominated watersheds characterised by arable land with minimal landscape structures, and two structure-dominated watersheds featuring a combination of arable land and linear landscape structures (mainly grassed waterways along thalwegs) that minimise sediment connectivity. Arable fields in both watershed groups were managed for soil conservation, including no-till and optimised crop rotations. A Generalised Likelihood Uncertainty Estimation (GLUE) framework was employed to account for measurement and model uncertainties across multiple spatiotemporal scales. Our results show that while WaTEM/SEDEM captured the magnitude of the very low measured sediment yields in the monitored watersheds, the model did not meet our pre-defined limits of acceptability when operating on annual time steps. Model performance improved substantially when outputs were averaged over the eight-year monitoring period, with mean absolute errors of 0.14 t ha⁻¹ yr⁻¹ for field-dominated and 0.29 t ha⁻¹ yr⁻¹ for structure-dominated watersheds. Our findings demonstrate that WaTEM/SEDEM can represent the influence of soil conservation practices on reducing soil erosion and sediment yield in our study area. However, the model is fit for long-term conservation planning at larger spatial scales and not for precise annual predictions for individual micro-scale watersheds with specific conservation practices even if high-resolution, high-quality input data are available for parameterisation.
@article{shokati2025glue, title = {A GLUE-based assessment of WaTEM/SEDEM for simulating soil erosion, transport, and deposition in soil conservation optimised agricultural watersheds}, author = {Seufferheld, K. D. and Batista, P. V. G. and Shokati, H. and Scholten, T. and Fiener, P.}, journal = {SOIL}, year = {2026}, doi = {https://doi.org/10.5194/soil-12-301-2026}, } - HESS
 Rapid flood mapping from aerial imagery using fine-tuned SAM and ResNet-backboned U-NetH. Shokati, K. D. Seufferheld, P. Fiener, and 1 more authorHydrology and Earth System Sciences, 2026
Flooding is a major natural hazard that requires a rapid response to minimize the loss of life and property and to facilitate damage assessment. Aerial imagery, especially images from unmanned aerial vehicles (UAVs) and helicopters, plays a crucial role in identifying areas affected by flooding. Therefore, developing an efficient model for rapid flood mapping is essential. In this study, we present two segmentation approaches for the mapping of flood-affected areas: (1) a fine-tuned Segment Anything Model (SAM), comparing the performance of point prompts versus bounding box prompts, and (2) a U-Net model with ResNet-50 and ResNet-101 as pre-trained backbones. Our results showed that the fine-tuned SAM performed best in segmenting floods with point prompts (Accuracy: 0.96, IoU: 0.90), while bounding box prompts led to a significant drop (Accuracy: 0.82, IoU: 0.67). This is because flood images often cover the image from edge to edge, making bounding box prompts less effective at capturing boundary details. For the U-Net model, the ResNet-50 backbone yielded an accuracy of 0.87 and an IoU of 0.72. Performance improved slightly with the ResNet-101 backbone, achieving an accuracy of 0.88 and an IoU of 0.74. This improvement can be attributed to the deeper architecture of ResNet-101, which allows more complex and detailed features to be extracted, improving U-Net’s ability to segment flood-affected areas accurately. The results of this study will help emergency response teams identify flood-affected areas more quickly and accurately. In addition, these models could serve as valuable tools for insurance companies when assessing damage. Moreover, the segmented flood images generated by these models can serve as training data for other machine learning models, creating a pipeline for more advanced flood analysis and prediction systems.
@article{shokati2025floodmapping, title = {Rapid flood mapping from aerial imagery using fine-tuned SAM and ResNet-backboned U-Net}, author = {Shokati, H. and Seufferheld, K. D. and Fiener, P. and Scholten, T.}, journal = {Hydrology and Earth System Sciences}, volume = {30}, pages = {743--756}, year = {2026}, publisher = {Copernicus Publications}, doi = {10.5194/hess-30-743-2026}, } - Catena
 Soil pH and latitude as a major predictor of C:N:P stoichiometry in GermanyP. Khosravani, N. M. Kebonye, R. Taghizadeh-Mehrjardi, and 3 more authorsCATENA, 2026
Soil stoichiometry governs nutrient cycling to ensure optimal ecosystem functionality. Although the soil carbon‑nitrogen‑phosphorus (C:N:P) stoichiometry and ecosystem functioning are closely related, much less is known about how environmental predictors regulate the spatial distribution of these ratios in temperate regions. Specifically, the statistical relationships of soil properties (such as soil pH and clay content), climate variables (like precipitation and temperature), and topographic features (i.e., slope and aspect) on C:N:P stoichiometric patterns at regional scales remain poorly understood. In our study, we combined Cubist machine learning for spatial predictions with state-of-the-art statistical approaches—generalized additive models and structural equation modeling—to disentangle the quantitative relationships between environmental predictors and soil C:N, C:P, and N:P ratios across Germany. The relative importance analysis of environmental predictors shows that soil pH is the major predictor of stoichiometric ratios, acting through its fundamental control on nutrient availability. Higher soil pH corresponded to lower stoichiometric ratios and vice versa. Latitude emerged as another important predictor due to its effect on temperature, which plays a crucial role in these ratios, such that increasing latitude corresponds to lower ratios. As expected, wall-to-wall spatial distribution maps of the stoichiometric ratios showed varying patterns due to different environmental predictor influences. These findings enhance our understanding of environmental-stoichiometric interactions and offer valuable insights needed for sustainable soil management in temperate regions.
@article{khosravani2026soil,
  title = {Soil pH and latitude as a major predictor of C:N:P stoichiometry in Germany},
  author = {Khosravani, P. and Kebonye, N. M. and Taghizadeh-Mehrjardi, R. and Shokati, H. and Hu, L. and Scholten, T.},
  journal = {CATENA},
  volume = {264},
  pages = {109785},
  year = {2026},
  publisher = {Elsevier},
  doi = {10.1016/j.catena.2025.109785},
}
2025
- Water
 Comparing UAV-Based Hyperspectral and Satellite-Based Multispectral Data for Soil Moisture Estimation Using Machine LearningH. Shokati, M. Mashal, A. Noroozi, and 8 more authorsWater, 2025
Accurate estimation of soil moisture content (SMC) is crucial for effective water management, enabling improved monitoring of water stress and a deeper understanding of hydrological processes. While satellite remote sensing provides broad coverage, its spatial resolution often limits its ability to capture small-scale variations in SMC, especially in landscapes with diverse land-cover types. Unmanned aerial vehicles (UAVs) equipped with hyperspectral sensors offer a promising solution to overcome this limitation. This study compares the effectiveness of Sentinel-2, Landsat-8/9 multispectral data and UAV hyperspectral data (from 339.6 nm to 1028.8 nm with spectral bands) in estimating SMC in a research farm consisting of bare soil, cropland and grassland. A DJI Matrice 100 UAV equipped with a hyperspectral spectrometer collected data on 14 field campaigns, synchronized with satellite overflights. Five machine-learning algorithms including extreme learning machines (ELMs), Gaussian process regression (GPR), partial least squares regression (PLSR), support vector regression (SVR) and artificial neural network (ANN) were used to estimate SMC, focusing on the influence of land cover on the accuracy of SMC estimation. The findings indicated that GPR outperformed the other models when using Landsat-8/9 and hyperspectral photography data, demonstrating a tight correlation with the observed SMC (R2 = 0.64 and 0.89, respectively). For Sentinel-2 data, ELM showed the highest correlation, with an R2 value of 0.46. In addition, a comparative analysis showed that the UAV hyperspectral data outperformed both satellite sources due to better spatial and spectral resolution. In addition, the Landsat-8/9 data outperformed the Sentinel-2 data in terms of SMC estimation accuracy. For the different land-cover types, all types of remote-sensing data showed the highest accuracy for bare soil compared to cropland and grassland. This research highlights the potential of integrating UAV-based spectroscopy and machine-learning techniques as complementary tools to satellite platforms for precise SMC monitoring. The findings contribute to the further development of remote-sensing methods and improve the understanding of SMC dynamics in heterogeneous landscapes, with significant implications for precision agriculture. By enhancing the SMC estimation accuracy at high spatial resolution, this approach can optimize irrigation practices, improve cropping strategies and contribute to sustainable agricultural practices, ultimately enabling better decision-making for farmers and land managers. However, its broader applicability depends on factors such as scalability and performance under different conditions.
@article{shokati2025soilmoisture, title = {Comparing UAV-Based Hyperspectral and Satellite-Based Multispectral Data for Soil Moisture Estimation Using Machine Learning}, author = {Shokati, H. and Mashal, M. and Noroozi, A. and Mirzaei, S. and Mohammadi-Doqozloo, Z. and Nabiollahi, K. and Taghizadeh-Mehrjardi, R. and Khosravani, P. and Adhikari, R. and Hu, L. and Scholten, T.}, journal = {Water}, volume = {17}, pages = {1715}, year = {2025}, publisher = {MDPI}, doi = {10.3390/w17111715}, } - CATENA Erosion-SAM: Semantic segmentation of soil erosion by waterH. Shokati, A. Engelhardt, K. Seufferheld, and 4 more authorsCATENA, 2025
Soil erosion (SE) by water threatens global agriculture by depleting fertile topsoil and causing economic costs. Conventional SE models struggle to capture the complex, non-linear interactions between SE drivers. Recently, machine learning has gained attention for SE modeling. However, machine learning requires large data sets for effective training and validation. In this study, we present Erosion-SAM, which fine-tunes the Segment Anything Model (SAM) for automatic segmentation of water erosion features in high-resolution remote sensing imagery. The data set comprised 405 manually segmented agricultural fields from erosion-prone areas obtained from the rain gauge-adjusted radar rainfall data (RADOLAN) for bare cropland, vegetated cropland, and grassland. Three approaches were evaluated: two pre-processing techniques— resizing and cropping — and an improved version of the resizing approach with user-defined prompts during the testing phase. All fine-tuned models outperformed the original SAM, with the prompt-based resizing method showing the highest accuracy, especially for grassland (recall: 0.90, precision: 0.82, dice coefficient: 0.86, IoU: 0.75). SAM performed better than the cropping approach only on bare cropland. This discrepancy is attributed to the tendency of SAM to overestimate SE by classifying a large proportion of fields as eroded, which increases recall by covering most of the eroded pixels. All three fine-tuned approaches showed strong correlations with the actual SE severity ratios, with the prompt-enhanced resizing approach achieving the highest R2 of 0.93. In summary, Erosion-SAM shows promising potential for automatically detecting SE features from remote sensing images. The generated data sets can be applied to machine learning-based SE modeling, providing accurate and consistent training data across different land cover types, and offering a reliable alternative to traditional SE models. In addition, erosion-SAM can make a valuable contribution to the precise monitoring of SE with high temporal resolution over large areas, and its results could benefit reinsurance and insurance-related risk solutions.
@article{shokati2025erosionsam,
  title = {Erosion-SAM: Semantic segmentation of soil erosion by water},
  author = {Shokati, H. and Engelhardt, A. and Seufferheld, K. and Taghizadeh, R. and Fiener, P. and Lensch, H. and Scholten, T.},
  journal = {CATENA},
  volume = {254},
  pages = {108954},
  year = {2025},
  publisher = {Elsevier},
  doi = {10.1016/j.catena.2025.108954},
}
2024
- Rem. Sens.
 BIPE: A Bi-Layer Predictive Ensemble Framework for Forest Fire Susceptibility Mapping in GermanyL. Hu, V. Hochschild, H. Neidhardt, and 3 more authorsRemote Sensing, 2024
Forest fires diminish forests’ ecological services, including carbon sequestration, water retention, air cooling, and recreation, while polluting the environment and endangering habitats. Despite considerable economic advancements, firefighting strategies remain less than optimal. This paper introduces the Bi-layer Predictive Ensemble (BIPE), an innovative machine learning model designed to enhance the accuracy and generalization of forest fire susceptibility mapping. BIPE integrates model-centric and data-driven strategies, employing automated methods such as 10-fold cross-validation and meta-learning to improve stability and generalization. During its 10-fold cross-validation, BIPE demonstrated excellent performance, with the Area Under the Curve (AUC) values ranging from 0.990 to 0.996 and accuracy levels consistently high, around 97%, underscoring its robust class separation ability and strong generalization across different datasets. Our results confirm that BIPE outperforms traditional high-performance models like Support Vector Machine (SVM), Multilayer Perceptron (MLP), Extreme Gradient Boosting (XGBoost), Deep Neural Network (DNN), and Convolutional Neural Network (CNN), showcasing its practical effectiveness and reliability on the data of nonlinear, high-dimensional, and complex interactions. Additionally, our forest fire susceptibility maps offer valuable complementary information for German forest fire management authorities, enhancing their ability to assess and manage fire risks more effectively.
@article{hu2024bipe, title = {BIPE: A Bi-Layer Predictive Ensemble Framework for Forest Fire Susceptibility Mapping in Germany}, author = {Hu, L. and Hochschild, V. and Neidhardt, H. and Schultz, M. and Khosravani, P. and Shokati, H.}, journal = {Remote Sensing}, volume = {17}, number = {1}, pages = {7}, year = {2024}, publisher = {MDPI}, doi = {10.3390/rs17010007}, } - Rem. Sens. Assessment of Land Suitability Potential Using Ensemble Approaches of Advanced Multi-Criteria Decision Models and Machine Learning for Wheat CultivationK. Nabiollahi, N. M. Kebonye, F. Molani, and 4 more authorsRemote Sensing, 2024
Land suitability assessment, as an important process in modern agriculture, involves the evaluation of numerous aspects such as soil properties, climate, relief, hydrology and socio-economic aspects. The aim of this study was to evaluate the suitability of soils for wheat cultivation in the Gavshan region, Iran, as the country is facing the task of becoming self-sufficient in wheat. Various methods were used to evaluate the land, such as multi-criteria decision-making (MCDM), which is proving to be important for land use planning. MCDM and machine learning (ML) are useful for decision-making processes because they use complicated spatial data and methods that are widely available. Using a geomorphological map, seventy soil profiles were selected and described, and ten soil properties and wheat yields were determined. Three MCDM approaches, including the technique of preference ordering by similarity to the ideal solution (TOPSIS), gray relational analysis (GRA), and simple additive weighting (SAW), were used and evaluated. The criteria weights were extracted using Shannon’s entropy method. Random forest (RF) model and auxiliary variables (remote sensing data, terrain data, and geomorphological maps) were used to represent the land suitability values. Spatial autocorrelation analysis as a statistical method was applied to analyze the spatial variability of the spatial data. Slope, CEC (cation exchange capacity), and OC (organic carbon) were the most important factors for wheat cultivation. The spatial autocorrelation between the key criteria (slope, CEC, and OC) and wheat yield confirmed these results. These results also showed a significant correlation between the land suitability values of TOPSIS, GRA, and SAW and wheat yield (0.74, 0.72, and 0.57, respectively). The spatial distribution of land suitability values showed that the areas classified as good according to TOPSIS and GRA were larger than those classified as moderate and weak according to the SAW approach. These results were also confirmed by the autocorrelation of the MCDM techniques with wheat yield. In addition, the RF model showed its effectiveness in processing complex spatial data and improved the accuracy of land suitability assessment. In this study, by integrating advanced MCDM techniques and ML, an applicable land evaluation approach for wheat cultivation was proposed, which can improve the accuracy of land suitability and be useful for considering sustainability principles in land management.
@article{nabiollahi2024landsuitability, title = {Assessment of Land Suitability Potential Using Ensemble Approaches of Advanced Multi-Criteria Decision Models and Machine Learning for Wheat Cultivation}, author = {Nabiollahi, K. and Kebonye, N. M. and Molani, F. and Tahari-Mehrjardi, M. H. and Taghizadeh, R. and Shokati, H. and Scholten, T.}, journal = {Remote Sensing}, volume = {16}, number = {14}, pages = {2566}, year = {2024}, publisher = {MDPI}, doi = {10.3390/rs16142566}, } - Land
 Assessing the Role of Environmental Covariates and Pixel Size in Soil Property Prediction: A Comparative Study of Various Areas in Southwest IranP. Khosravani, M. Baghernejad, R. Taghizadeh, and 6 more authorsLand, 2024
The use of multiscale prediction or the optimal scaling of predictors can enhance soil maps by applying pixel size in digital soil mapping (DSM). A total of 200, 50, and 129 surface soil samples (0–30 cm) were collected by the CLHS method in three different areas, namely, the Marvdasht, Bandamir, and Lapuee plains in southwest Iran. Then, four soil properties—soil organic matter (SOM), bulk density (BD), soil shear strength (SS), and mean weighted diameter (MWD)—were measured at each sampling point as representative attributes of soil physical and chemical quality. This study examined different-scale scenarios ranging from resampling the original 30 m digital elevation model and remote sensing indices to various pixel sizes, including 60 × 60, 90 × 90, 120 × 120, and up to 2100 × 2100 m. After evaluating 22 environmental covariates, 11 of them were identified as the most suitable candidates for predicting soil properties based on recursive feature elimination (RFE) and expert opinion methods. Furthermore, among different pixel size scenarios for SOM, BD, SS, and MWD, the highest accuracy was achieved at 1200 × 1200 m (R2 = 0.35), 180 × 180 m (R2 = 0.67), 1200 × 1200 m (R2 = 0.42), and 2100 × 2100 m (R2 = 0.34), respectively, in Marvdasht plain. Adjusting the pixel size improves the capture of soil property variability, enhancing mapping precision and supporting effective decision making for crop management, irrigation, and land use planning.
@article{khosravani2024environmental, title = {Assessing the Role of Environmental Covariates and Pixel Size in Soil Property Prediction: A Comparative Study of Various Areas in Southwest Iran}, author = {Khosravani, P. and Baghernejad, M. and Taghizadeh, R. and Mousavi, S. R. and Moosavi, A. A. and Fallah Shamsi, S. R. and Shokati, H. and Kebonye, N. M. and Scholten, T.}, journal = {Land}, volume = {13}, number = {8}, pages = {1309}, year = {2024}, publisher = {MDPI}, doi = {10.3390/land13081309}, } - Rem. Sens. Random Forest-Based Soil Moisture Estimation Using Sentinel-2, Landsat-8/9, and UAV-Based Hyperspectral DataH. Shokati, M. Mashal, A. Noroozi, and 7 more authorsRemote Sensing, 2024
Accurate spatiotemporal monitoring and modeling of soil moisture (SM) is of paramount importance for various applications ranging from food production to climate change adaptation. This study deals with modeling SM with the random forest (RF) algorithm using datasets comprising multispectral data from Sentinel-2, Landsat-8/9, and hyperspectral data from the CoSpectroCam sensor (CSC, licensed to AgriWatch BV, Enschede, The Netherlands) mounted on an unmanned aerial vehicle (UAV) in Iran. The model included nine bands from Landsat-8/9, 11 bands from Sentinel-2, and 1252 bands from the CSC (covering the wavelength range between 420 and 850 nm). The relative feature importance and band sensitivity to SM variations were analyzed. In addition, four indices, including the perpendicular index (PI), ratio index (RI), difference index (DI), and normalized difference index (NDI) were calculated from the different bands of the datasets, and their sensitivity to SM was evaluated. The results showed that the PI exhibited the highest sensitivity to SM changes in all datasets among the four indices considered. Comparisons of the performance of the datasets in SM estimation emphasized the superior performance of the UAV hyperspectral data (R2 = 0.87), while the Sentinel-2 and Landsat-8/9 data showed lower accuracy (R2 = 0.49 and 0.66, respectively). The robust performance of the CSC data is likely due to its superior spatial and spectral resolution as well as the application of preprocessing techniques such as noise reduction and smoothing filters. The lower accuracy of the multispectral data from Sentinel-2 and Landsat-8/9 can also be attributed to their relatively coarse spatial resolution compared to the CSC, which leads to pixel non-uniformities and impurities. Therefore, employing the CSC on a UAV proves to be a valuable technology, providing an effective link between satellite observations and ground measurements.
@article{shokati2024randomforest,
  title = {Random Forest-Based Soil Moisture Estimation Using Sentinel-2, Landsat-8/9, and UAV-Based Hyperspectral Data},
  author = {Shokati, H. and Mashal, M. and Noroozi, A. and Abkar, A.A. and Mirzaei, S. and Mohammadi-Doqozloo, Z. and Taghizadeh, R. and Khosravani, P. and Nabiollahi, K. and Scholten, T.},
  journal = {Remote Sensing},
  volume = {16},
  number = {11},
  pages = {1962},
  year = {2024},
  publisher = {MDPI},
  doi = {10.3390/rs16111962},
}
2023
- Desert
 Evaluating the Accuracy of Precipitation Products Over Utah, United States, Using the Google Earth Engine PlatformH. Shokati, M. Mashal, A.A. Noroozi, and 1 more authorDesert, 2023
Satellite-based precipitation missions can be used to estimate precipitation distribution, especially in areas where there are no rain gauging stations. Nevertheless, these products are still less used because of the lack of accuracy evaluation. This study evaluates the monthly rainfall values of five satellite precipitation products, including ERA5, GPM, CHIRPS, TRMM 3B43, and PERSIANN-CDR, at eight rain gauge networks over Utah, United States using Google Earth Engine platform (GEE). For this purpose, different validating indices such as R2, RMSE, and MAE were used to evaluate the accuracy of mentioned products from 2009 to 2019. The results showed that CHIRPS outperformed other rainfall products in this region with an R2 value of 0.63. ERA5 ranked second with an R2 of 0.6, and GPM, TRMM, and PERSIANNCDR were in the subsequent ranks with R2 values of 0.53, 0.52, and 0.32, respectively. The results also indicated that spatial resolution is directly related to the accuracy of the results. CHIRPS rainfall product had the highest spatial resolution (0.05°) among all studied products, which led to the most reliable results. On the other hand, the lowest spatial resolutions belonged to TRMM and PERSIANN-CDR (0.25°), which resulted in the weakest results. The results also revealed that the ERA5 precipitation product was more influenced by elevation, longitude, and rainfall factors than other products.
@article{shokati2023precipitation, title = {Evaluating the Accuracy of Precipitation Products Over Utah, United States, Using the Google Earth Engine Platform}, author = {Shokati, H. and Mashal, M. and Noroozi, A.A. and Mirzaei, S.}, journal = {Desert}, volume = {28}, number = {1}, pages = {145--162}, year = {2023}, doi = {10.22059/jdesert.2023.93548}, } - RSASE
 Assessing soil moisture levels using visible UAV imagery and machine learning modelsH. Shokati, M. Mashal, A. Noroozi, and 2 more authorsRemote Sensing Applications: Society and Environment, 2023
The estimation of soil moisture (SM) as an important variable in the hydrological cycle of nature is necessary for the optimal management of water and soil resources. One of the indirect methods to estimate SM is using visible imagery with unmanned aerial vehicles (UAVs). This study aims to evaluate the potential of visible UAV imagery for estimating SM in a bare soil field in Iran. In this study, M5 tree (M5P), random forest (RF), sequential minimal optimization regression (SMOreg), and multilayer perceptron (MLP) methods have been used for SM modeling from RGB (Red, Green and Blue) bands and brightness and intensity indices of aerial imagery. Three evaluation methods were used to assess the accuracy of the models, including the coefficient of determination (R2), root mean square error (RMSE), and mean absolute error (MAE). Four different indices, including difference index (DI), ratio index (RI), normalized difference index (NDI), and perpendicular index (PI), were used to estimate SM. The green and red bands pair were found to be the optimal bands for SM estimation. The findings showed that the PI index provided the most accurate SM estimates (R2 = 0.51). The RF model predicted SM most accurately among the machine learning models tested (R2 = 0.67). However, all models underestimated SM content in high-moisture areas and overestimated it in low-moisture areas, with the MLP model showing the most significant overestimation. All the indices were saturated beyond 25% SM. In general, this study highlighted the potential of aerial RGB imagery and associated indices for assessing SM levels within bare soil fields. However, it should be noted that the use of individual bands and indices alone is not sufficient to make an accurate estimate of SM.
@article{shokati2023uavimagery,
  title = {Assessing soil moisture levels using visible UAV imagery and machine learning models},
  author = {Shokati, H. and Mashal, M. and Noroozi, A. and Mirzaei, S. and Mohammadi-Doqozloo, Z.},
  journal = {Remote Sensing Applications: Society and Environment},
  volume = {32},
  pages = {101076},
  year = {2023},
  publisher = {Elsevier},
  doi = {10.1016/j.rsase.2023.101076},
}
2022
- J. Water Soil
 Estimation of Evapotranspiration in Landscape by WUCOLS, PF and IPOS MethodsZ. Sojoodi, H. Shokati, and M. MashalJournal of Water and Soil, 2022In Persian
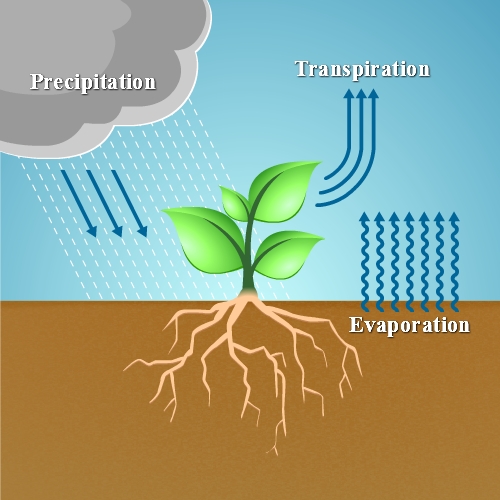
The constructive effects of green spaces on the quality and livability of the urban environment have been reported in many studies. Therefore, using methods that can accurately estimate the evaporation of transpiration in green space can help to reduce water loss. The purpose of estimating water demand for urban green space is also different from the purpose of determining water demand for an agricultural farm. In urban green space, the goal is to maintain good growth, appearance and acceptable plant health, while biomass production is the main goal on agricultural farms. Therefore, urban green space can typically be managed using an irrigation area that is less than the amount of water needed to produce agricultural products. Due to the limited water resources in arid areas, the use of less irrigation in urban green space can be desirable to save water consumption. The Wucols method for estimating Water requirements in green space was developed by Castello et al. (4). They developed the Wucols water taxonomy guidelines for planting green space in California. The Wucols method estimates evapotranspiration in green space using reference evapotranspiration and a set of coefficients (Species factor, density factor and microclimate factor). PF method is the minimum acceptable irrigation for green space plants that emphasizes maintaining the beauty of the plant. In this method, the water required by green space plants is considered as a percentage of ET0 so as not to reduce their appearance and performance. In this approach, PF is a regulatory factor that is actually considered instead of Kc and multiplied by ET0, except that the emphasis is on the appearance of the plant and not on its optimal growth and yield. The IPOS method has been developed by the Government of South Australia for planning and managing water needs in public open spaces, especially sports lawns and amusement parks. In this method, the water requirement of grass in urban open space is calculated. In this method, plant transpiration evaporation (ETL) is calculated by multiplying reference transpiration evaporation factors (ET0) by grass vegetation coefficient (Kc) by plant stress factor (Kst). The results showed that the highest rate of evapotranspiration obtained by Wucols method was 83.38 mm during 21 Jun-21 Jul. Also, the rate of transpiration evaporation during one year of the experimental period was estimated to be 556.5 mm. The results of estimation of transpiration evaporation by PF method also show the maximum amount of transpiration evaporation during 21 Jun-21 Jul and is 75.55 mm. The evapotranspiration rate during one year was estimated to be 505.9 mm. For the Ipos method, the highest rate of transpiration evaporation was estimated to be 36.38 mm during 21 Jun-21 Jul and 242.9 mm during the experimental period. Gross irrigation requirement is estimated by considering 70% irrigation efficiency for each month using all three methods. For the Wucols method, the gross irrigation need during one year was estimated to be 794.8 mm. For the PF method was 722.7 mm and for the IPOS method was 346.9 mm. According to the reported irrigation records for the study area, which is 900 mm per year, the Wucols method had the closest result to the irrigation records. The results showed that the Wucols method has the best and closest estimate according to the irrigation records of the study area. The gross irrigation requirement calculated by the Wucols method during a year is 794.8 mm, which is 12% less than the gross annual irrigation requirement of the studied green space. While PF and IPOS methods determined the amount of gross demand 20 and 62% less than the annual irrigation rate in the region, respectively. The results of this study show that the Wucols method for estimating the water requirement of plants in urban green space where there is a combination of different plant species is more reliable than the PF and IPOS methods due to the diversity of species, vegetation density and different climates.
@article{sojoodi2022evapotranspiration, title = {Estimation of Evapotranspiration in Landscape by WUCOLS, PF and IPOS Methods}, author = {Sojoodi, Z. and Shokati, H. and Mashal, M.}, journal = {Journal of Water and Soil}, year = {2022}, note = {In Persian}, doi = {10.22067/JSW.2022.73984.1119}, } - J. Water Soil
 Optimization and Feasibility Study of using Rainwater Harvesting Systems in ArdabilH. Shokati, Z. Sojoodi, and M. MashalJournal of Water and Soil, 2022In Persian
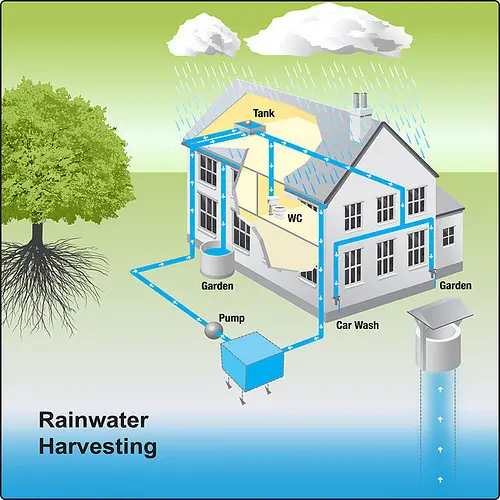
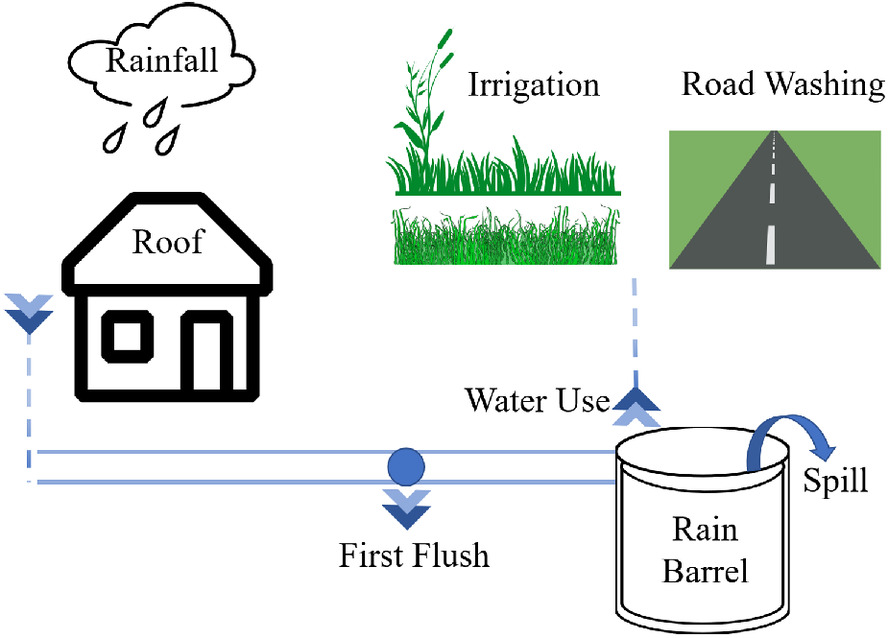
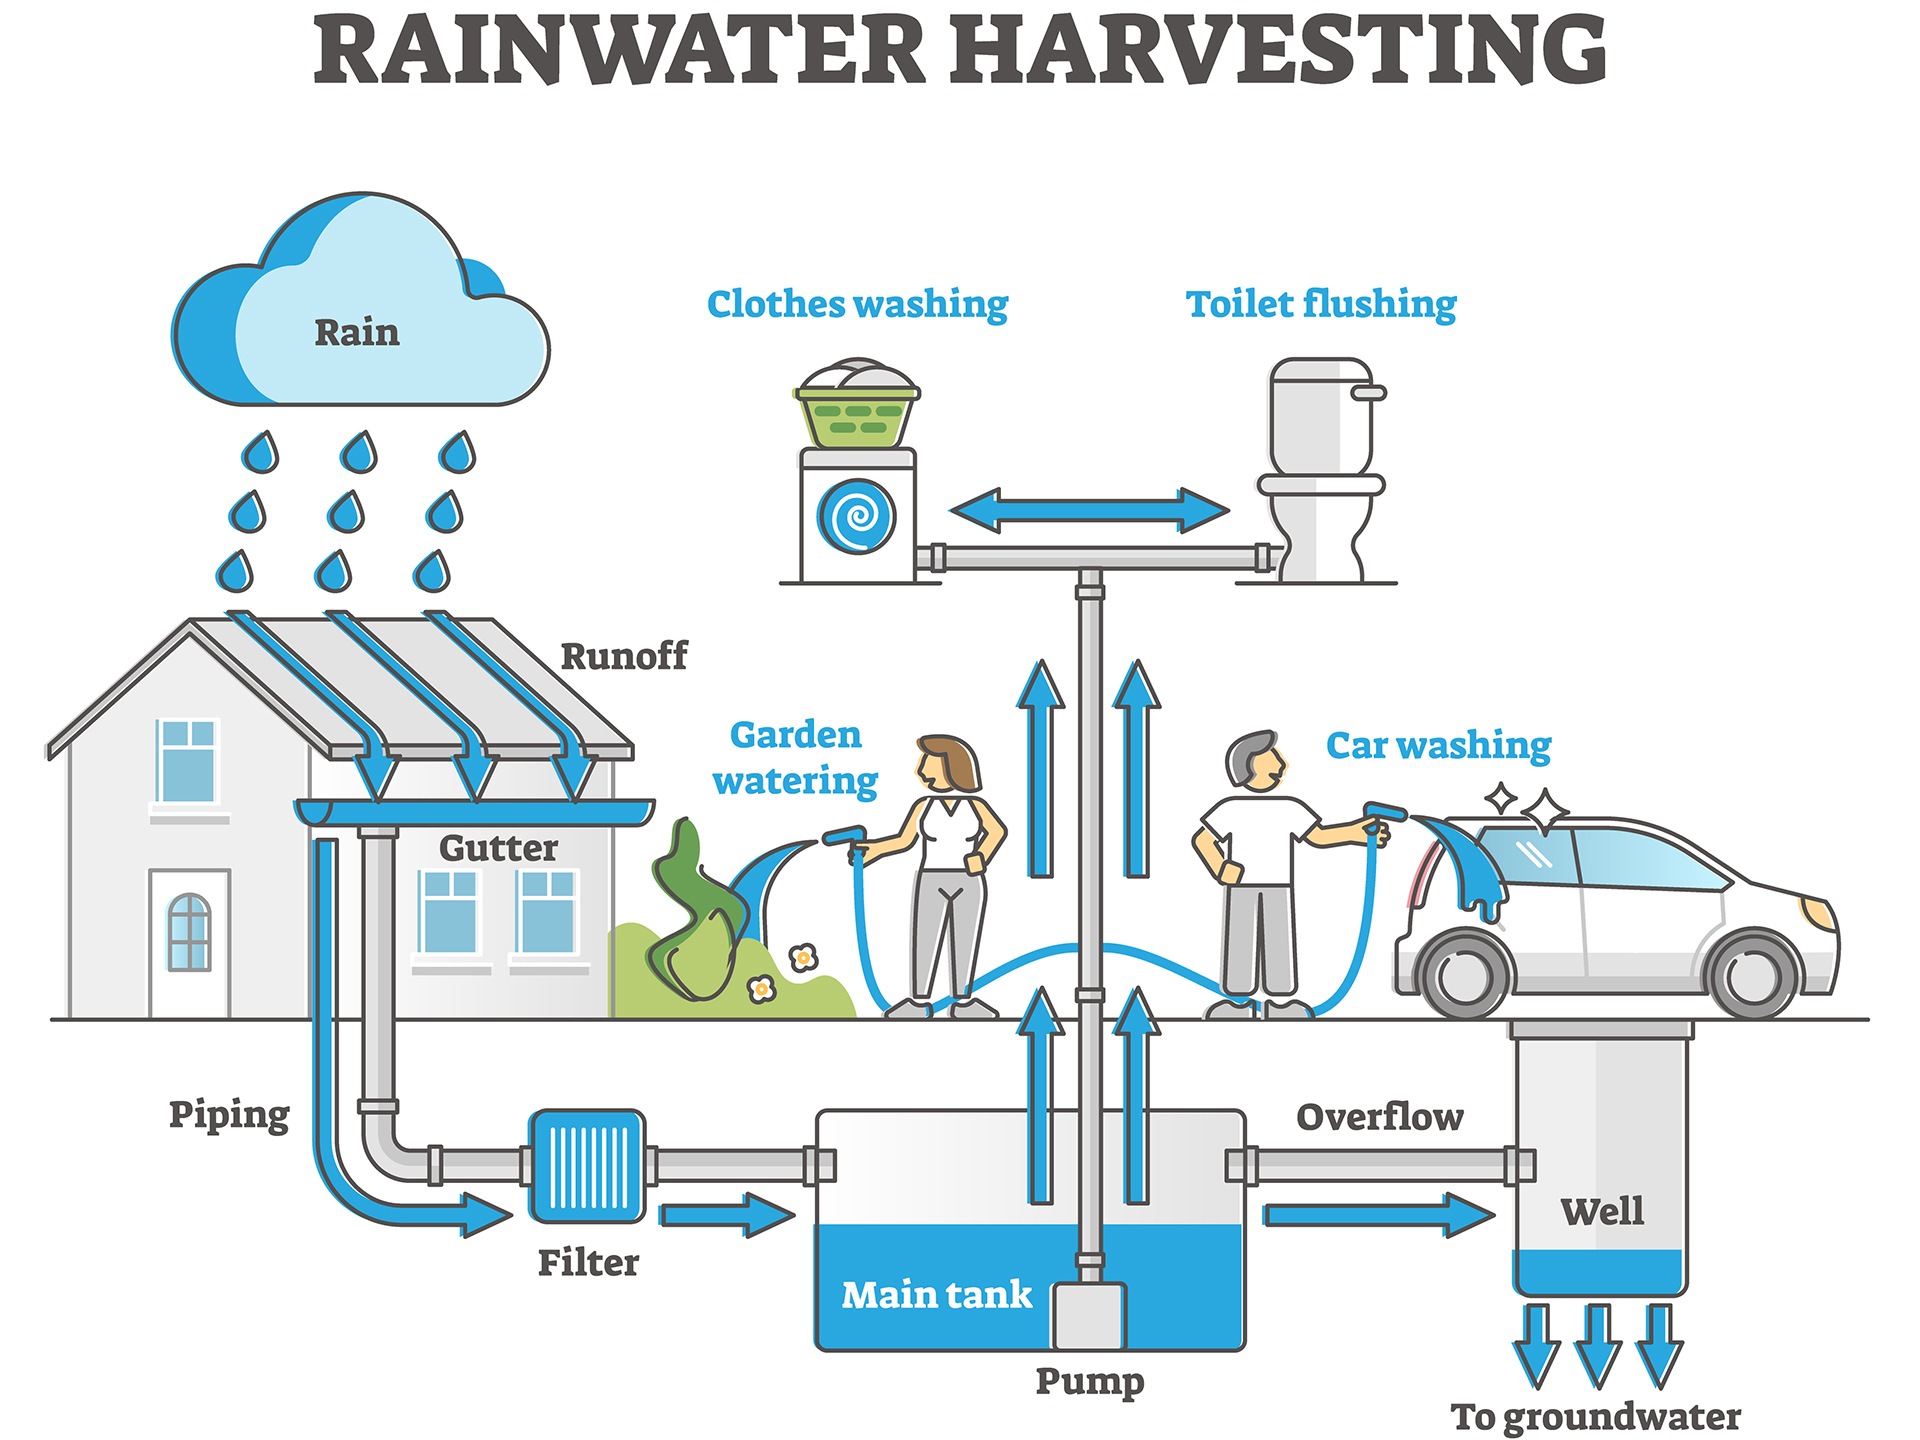
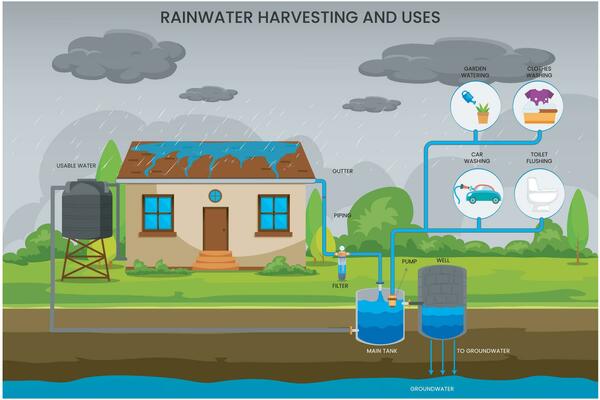
Arid and semi-arid climates prevail in Iran. The precipitation is also sparsely distributed in most areas of the country. Therefore, there is a need for management measures to overcome the water crisis. One of these measures is designing rainwater harvesting systems that can meet some of the non-potable needs and reduce runoff in urban areas. The main components of rainwater harvesting systems in residential regions include the catchment area, storage tank, and water transfer system from the catchment area to the tank. The storage tank is the biggest investment in a rainwater harvesting system, as most buildings are not equipped with a storage system. Therefore, tank capacity should be determined optimally to minimize project implementation costs. The stored water volume and the project profit increases with increasing the tank volume. However, in this case, the price of the tank increases. Therefore, the tank capacity should be optimally designed to justify economic exploitation. In order to evaluate the feasibility of using rainwater harvesting systems, the tanks’ volume was optimized. Due to the higher rainfall of Ardabil relative to the average rainfall of the country, it is expected that this area has a good potential for the implementation of rainwater harvesting systems. Therefore, this region was selected as the study area under the scenario of a residential house with 100 and 200 m2 catchment areas and four inhabitants. The amount of rainfall in the region is one of the primary parameters in determining the volume of rainwater collection tanks. Some of the precipitated water is always inaccessible due to evaporation from the surface. Nonetheless, since there is almost no sunlight during and immediately after rainfall, and also the received water enters the reservoirs shortly after precipitation, evaporation was assumed to be zero. Daily precipitation data for 42 years (from 1977 to 2019) were retrieved from the Ardabil Meteorological site. The daily water balance modeling method was used to analyze the rainwater harvesting systems due to the simplicity of interpretation, high accuracy and better general acceptance. Daily precipitation data were entered into this model and used as the primary source to meet the domestic demands. Simulation of rainwater harvesting systems was performed using daily precipitation data in MATLAB software, and the reliability of these systems was calculated for different tank volumes. Then, considering the price of drinking water and the current price of tanks in the market, the optimal volume of tanks was calculated using the Genetic Algorithm. Finally, the annual volume of water supply and the amount of water savings in case of using the optimal volumes of tanks were also estimated. The results showed that the percentage of reliability is directly related to the volume of the tank, thus, the reliability percentage also increases with increasing the tank capacity. As the volume of the tank increases, the slope of the increasing reliability percentage decreases continuously, to the point that this slope becomes almost zero. Comparing the reliability percentage obtained for 100 and 200 m2 rooftops indicated that 200 m2 rooftop had a higher reliability percentage than 100 m2 rooftop due to receiving much more rainfall and meeting the water need for a longer duration. By comparing the results of overflow ratio for 100 and 200 m2 rooftops, it can also be concluded that using a fixed size tank, the overflow in 200 m2 rooftop is higher, which is due to receiving more water volume than 100 m2 rooftop. The results also showed that by using a 5 m3 tank, 44.5 and 24 m3 of water can be stored annually from the 200 and 100 m2 catchment areas, respectively, these are equal to 28 and 19 m3, respectively, if 1 m3 tank is used. The optimal tank volumes for 100 and 200 m3 rooftops are equal to 0.59 and 1.66 m3, respectively. Since the tanks are made in specific volumes, the obtained volumes were rounded to the closest volumes available in the market. Thus, a 1.5 m3 tank was used for a 200 m2 rooftop and a 0.5 m3 tank was applied for a 100 m2 rooftop. Application of a tank of 0.5 m3 for the rooftop of 100 m2 was the most profitable for saving 17% of water consumption, annually. Moreover, the optimal tank volume for the 200 m2 rooftop was selected to be 1.5 m3, saving about 32 % of water consumption per year. Water-saving percentages indicate the high potential of our study area for the implementation of rainwater harvesting systems.
@article{shokati2022ardabil,
  title = {Optimization and Feasibility Study of using Rainwater Harvesting Systems in Ardabil},
  author = {Shokati, H. and Sojoodi, Z. and Mashal, M.},
  journal = {Journal of Water and Soil},
  year = {2022},
  note = {In Persian},
  doi = {10.22067/JSW.2022.73460.1111},
}
2021
- Eng. J.
 Designing of Rainwater Harvesting Systems Using Drone ImagesH. Shokati, M. Kouchakzadeh, and A. NorooziEngineering Journal, 2021In Persian
Iran is facing shortage of water resources due to the climate in which it is located. Since large areas of urban surfaces are Impenetrable streets, the volume of water harvested from these surfaces is significant and can reduce the pressure on water resources and meet a large portion of the non-potable demands, it also prevents the spread of pollution caused by overflows and backlogs in surface water collection facilities and uneconomic increase of their volumes. In this paper, the design of rainwater harvesting system from asphalt surfaces was carried out with the aim of meeting part of the green space demand of Tarbiat Modares University faculty of agriculture, using drone images. For this purpose, available data of 22 years of daily precipitation and 761 aerial images were obtained using DJI Phantom3 Professional drone. Then, the digital elevation map of the case study was prepared and to determine the runoff direction, the basin of the area was carried out in the GIS. Reliability percentage and overflow ratios of the tanks were estimated for each level for different tank volumes. Then the optimal volume of each tank was determined using genetic algorithm. The results showed that due to the topographic status of the faculty street surfaces, the runoff from them could not be collected in one tank, so 4 tanks A, B, C and D with optimized volumes of 6.15, 3.46, 1 and 20 cubic meters were considered in different parts of the street surfaces, respectively. With designing rainwater harvesting systems, a significant amount of rainwater can be stored for non-potable consumption.
@article{shokati2021drone, title = {Designing of Rainwater Harvesting Systems Using Drone Images}, author = {Shokati, H. and Kouchakzadeh, M. and Noroozi, A.}, journal = {Engineering Journal}, volume = {14}, number = {48}, pages = {73--85}, year = {2021}, note = {In Persian}, doi = {10.30495/wej.2021.4590}, } - IJID
 Reliability, Optimization and Economic Analysis of the Rainwater Harvesting System from the RooftopH. Shokati, M. Kouchakzadeh, and A. NorooziIranian Journal of Irrigation and Drainage, 2021In Persian
Performance assessing and economic analysis of rainwater harvesting systems, which is one of the most effective methods to deal with the crisis of water scarcity, will lead to better management of these systems. The purpose of this study was to evaluate the performance of rainwater harvesting systems, Musanejad dormitory and sports club buildings in Tarbiat Modares University, Faculty of Agriculture were selected as study areas. Then, the 22 years old daily precipitation data of the Chitgar Weather Station was prepared. System simulation was performed in Matlab software and reliability and overflow ratio of storage tanks were determined. The Genetic Algorithm was used to determine the optimal volume of the tanks of both buildings and finally, an economic analysis of these systems was carried out using the Net Present Value method and benefit-cost ratio. The results showed that the optimum volume of tanks for the Sports Club and Musanejad dormitory was 2,415 and 1 cubic meters, respectively. These tanks can store up to 82 and 120 cubic meters of water per year, respectively. The results also showed that the performance of rainwater harvesting systems was beneficial for the Musanejad dormitory but had no economic justification for the sports club due to low demand and high overflow.
@article{shokati2021reliability,
  title = {Reliability, Optimization and Economic Analysis of the Rainwater Harvesting System from the Rooftop},
  author = {Shokati, H. and Kouchakzadeh, M. and Noroozi, A.},
  journal = {Iranian Journal of Irrigation and Drainage},
  year = {2021},
  note = {In Persian},
}
2020
- Model. Earth Syst. Environ.
 Assessing reliability of rainwater harvesting systems for meeting water demands in different climatic zones of IranH. Shokati, M. Kouchakzadeh, and F.H. FashiModeling Earth Systems and Environment, 2020
Assessing the performance of rainwater harvesting systems, which is one of the effective ways to cope with the water shortage crisis, leads to better management of these systems. In this paper, the reliability of rainwater harvesting systems and the overflow ratio of storage tanks were investigated for different climatic conditions, different volumes of tanks, and different roof areas. The results indicated that in the cities of Rasht, Sari, Tabriz, and Yazd, using a 10-m3 tank, non-potable water needs of a four-person family can be supplied from a 100-m2 roof area for 67.3, 42.98, 12.07, and 1.35% of the days during a year. Further, if a 1-m3 tank is used in Rasht, 50.67% of the total harvested water will be overflowed, which would decrease to 19.21% if the 10-m3 tank is replaced. For Tabriz, the ratio of overflow from the 5-m3 tank was zero, but for the city of Sari, even with use of a 10-m3 tank, 0.73% overflow occurred. In addition, for Yazd city, using a 1-m3 tank, an overflow of 48.4% occurred, but when the volume of the tank was increased to 2 m3, there was no overflow. For the city of Tabriz, the ratio of overflow from the 5-m3 tank was zero, but for the city of Sari, even using a 10-m3 tank, 0.73% overflow occurred. For a constant volume of storage, as long as the average rainfall of the area was high, the ratio of overflow was also elevated. The ratio of overflow, from the highest to the lowest, was related to the temperate climate of the Caspian Sea and the pseudo-Mediterranean climate, moderate and humid climate, mountainous climate, and desert hot and dry climate, respectively.
@article{shokati2020rainwater,
  title = {Assessing reliability of rainwater harvesting systems for meeting water demands in different climatic zones of Iran},
  author = {Shokati, H. and Kouchakzadeh, M. and Fashi, F.H.},
  journal = {Modeling Earth Systems and Environment},
  volume = {6},
  number = {1},
  pages = {109--114},
  year = {2020},
  publisher = {Springer},
  doi = {10.1007/s40808-019-00662-3},
}
2019
- JESS
 Urban runoff management in sustainable development and the environmentH. Shokati, M. Kouchakzadeh, and A.A. NorooziJournal of Environmental Science Studies, 2019In Persian
Streets and roofs of buildings in cities will act as an obstacle to the penetration of rainwater into the soil, resulting in increased runoff in the city. One of the practical solutions that can be effective in addition to meet part of the non-potable needs of the residents is to reduce the runoff of the city’s surface and its damages, as well as the Performance of rainwater harvesting systems. In this method, a large part of runoff is stored in the tanks. In this paper, by simulating the roofing surfaces system of residential buildings in Matlab, optimization of rainwater storage tanks in Karaj and Ahvaz was investigated. According to optimal tank volume, rainfall statistics and specifications of residential buildings, to analyze the volume of water can be saved and volume of overflowed water from tanks were evaluated and an estimate of the number of days of the year that can be used by this runoff to meet the non- potable needs of the inhabitants. The results showed that although average annual rainfall of Ahvaz is lower than Karaj, the overflow ratio of the tank in Ahvaz is higher due to the irregularity of the precipitation process in this city and the percentage of precipitation to runoff is higher.
@article{shokati2019urbanrunoff,
  title = {Urban runoff management in sustainable development and the environment},
  author = {Shokati, H. and Kouchakzadeh, M. and Noroozi, A.A.},
  journal = {Journal of Environmental Science Studies},
  volume = {4},
  number = {1},
  pages = {1100--1107},
  year = {2019},
  note = {In Persian},
}
Conference Papers
2025
- DBG 2025
 Fine-tuning the Segment Anything Model for Automated Flood Detection in Aerial ImageryH. Shokati, K. Seufferheld, P. Fiener, and 1 more authorIn Annual Meeting of the German Soil Science Society 2025, Sep 202513-18 September 2025
Floods are among the most common natural disasters worldwide, requiring a rapid response to minimize the loss of life and property. Flood management involves four phases: prevention, preparedness, response, and recovery. Aerial imagery captured by unmanned aerial vehicles (UAVs) or helicopters after a flood plays a crucial role in the response and recovery phases, enabling damage assessment and speeding up the recovery process. However, processing large amounts of aerial imagery immediately after a flood is very time-consuming, delaying a rapid response and potentially exacerbating human and financial losses. Therefore, developing a model capable of automatically and efficiently identifying flooded areas immediately after a flood is of utmost importance. The Segment Anything Model (SAM) is a flexible pre-trained model designed to automatically segment a variety of objects without the need for further training. Although SAM performs impressively, its effectiveness can be limited in complex scenarios, such as precise flood segmentation, where accuracy is essential for efficient response and recovery operations. To overcome this limitation, this study fine-tuned the SAM using transfer learning techniques. The fine-tuning process leveraged the Flood Area dataset, which comprises 290 aerial images and their corresponding masks taken after flood events. During fine-tuning, point and bounding box prompts were used to improve the performance of the model. The results showed that the fine-tuned SAM with point prompts outperformed the bounding box prompts, achieving an intersection over union (IoU) of 0.90 and an accuracy of 0.96, compared to an IoU of 0.67 and an accuracy of 0.82 for the bounding box prompts. This result, which contrasts with the results of most studies comparing these two prompting methods on other tasks, is attributed to the nature of flooding. In most aerial images after floods, water often covers the majority of the image, causing the bounding box to encompass the entire image. Consequently, bounding box prompts convey less information about flood boundaries compared to point-based prompts. The results of this study highlight the great potential of the fine-tuned SAM model, especially with point prompts, in quickly and accurately identifying flooded areas. This capability not only enables faster response times and accelerates recovery processes but also has practical applications in rapid damage assessment for insurance companies.
@inproceedings{shokati2025dbg, title = {Fine-tuning the Segment Anything Model for Automated Flood Detection in Aerial Imagery}, author = {Shokati, H. and Seufferheld, K. and Fiener, P. and Scholten, T.}, booktitle = {Annual Meeting of the German Soil Science Society 2025}, year = {2025}, address = {Tübingen, Germany}, month = sep, note = {13-18 September 2025}, } - EGU 2025
 Automated high-resolution detection of soil erosion and deposition features in agricultural fields using the fine-tuned Segment Anything ModelH. Shokati, A. Engelhardt, K. Seufferheld, and 3 more authorsIn EGU General Assembly 2025, Apr 202527 April - 2 May 2025, EGU25-827
Water-induced soil erosion is a critical threat to the sustainability of agriculture worldwide, as it destroys nutrient-rich topsoil and causes significant economic costs. Conventional soil erosion monitoring methods, such as the Universal Soil Loss Equation (USLE) and its revised version (RUSLE), often face challenges with data collection for calibration or validation. Although machine learning offers promising alternatives, they usually require large data sets, which can limit their practicality. Recent advances in deep learning have introduced several innovative techniques such as transfer learning to reduce the need for extensive data. This study presents Erosion-SAM, a novel framework that fine-tunes the Segment Anything Model (SAM) to automatically identify erosion and deposition features using high-resolution remote sensing imagery. RADOLAN radar rainfall data with a spatial resolution of 1 km was used to identify erosive events and determine erosion-prone agricultural fields including grassland, vegetated cropland, and bare cropland, in southeastern Bavaria, Germany. High-resolution orthophotos (0.2 m) were taken for fields with erosive events indicating significant erosion potential. These orthophotos were then manually segmented by experts to delineate precise erosion and deposition features and subsequently used as input data for fine-tuning SAM. Three pre-processing strategies were evaluated during the fine-tuning process: resizing, cropping, and prompt-based resizing. The prompt-based resizing method performed best, especially in grassland, with an IoU of 0.75, a Dice coefficient of 0.86, a precision of 0.82 and a recall of 0.90. While the baseline SAM performed better than the cropping method in bare cropland, it overestimated erosion and deposition, which increased the recall values. The fine-tuned methods agreed well with the actual soil erosion severity ratios, with the prompt-based resizing method achieving an R2 of 0.93, demonstrating superior predictive performance. Erosion-SAM showcases the potential to revolutionize soil erosion monitoring by automatically detecting erosion and deposition features across different land covers with high accuracy. Moreover, it generates high-quality, consistent data sets as valuable input for machine learning-based erosion modeling for different land covers. Its scalability and high spatial and temporal resolution also make it invaluable for large-scale erosion monitoring and risk assessment, including applications in the insurance and reinsurance industry.
@inproceedings{shokati2025egu, title = {Automated high-resolution detection of soil erosion and deposition features in agricultural fields using the fine-tuned Segment Anything Model}, author = {Shokati, H. and Engelhardt, A. and Seufferheld, K. and Taghizadeh, R. and Fiener, P. and Scholten, T.}, booktitle = {EGU General Assembly 2025}, year = {2025}, address = {Vienna, Austria}, month = apr, note = {27 April - 2 May 2025, EGU25-827}, doi = {10.5194/egusphere-egu25-827}, } - EGU 2025 WaTEM/SEDEM’s capability in simulating watershed-scale soil conservation: Using the GLUE approach to analyse the representation of in-field processes and connectivity features along thalwegsK. D. Seufferheld, P. V. G. Batista, H. Shokati, and 2 more authorsIn EGU General Assembly 2025, Apr 202527 April - 2 May 2025, EGU25-1799
Testing the performance of soil erosion models against observational data is a critical step in any model application. This is particularly important when models aid land-management decisions, e.g. planning and implementing soil conservation practices in agricultural landscapes. However, observational erosion data are uncertain and typically restricted to measurements of sediment fluxes at the outlet of a system, e.g. plot or watershed. This has limited utility for testing a model’s representation of landscape sediment connectivity processes, which is crucial for planning soil conservation and off-site pollution control measures. Here, the performance of a Python-implemented version of the spatially distributed soil erosion and sediment yield WaTEM/SEDEM model was evaluated for simulating sediment yields under soil conservation conditions across contrasting watersheds at an experimental farm in Southern Germany. To do so, we used an eight-year monitoring dataset (1994-2001) that includes high-resolution measurements of soil properties, plant traits, and land management operations, as well as event-based sediment yield measurements for (I) four small-scale watersheds (0.8 to 4.2 ha) primarily representing in-field erosion processes (mostly supply-limited) and (II) two cascading watersheds (5.7 to 7.8 ha) dominated by sedimentation processes along a grassed waterway (mostly transport-limited). Further, we employed a Generalised Likelihood Uncertainty Estimation (GLUE) rejectionist framework utilising Monte Carlo simulations with 25,000 iterations to condition model parameters. The model performance was evaluated across two spatial scales - from individual watersheds to aggregated supply-limited and transport-limited watershed groups - and temporal scales ranging from single-year to eight-year averages. Model iterations were considered as behavioural when their simulated sediment yields fell within an estimated error range derived from the monitoring dataset. The model demonstrated capability in simulating low sediment yields when aggregated spatially and temporally. However, the annual-scale model applications were rejected due to insufficient representation of temporal dynamics. The results indicated a systematic overestimation of sediment yields across most watersheds, with a notable exception in one transport-limited catchment where underestimation occurred. The influence of retention features within watersheds was reflected by the behavioural parameter selection: in cases of sediment yield overestimation, parameters enhancing deposition produced superior results, while in watersheds with underestimated sediment yields, parameters reducing deposition improved model performance. These observations underscore the model’s capability to represent low sediment yields in agricultural landscapes under soil conservation while highlighting temporal resolution limitations and the importance of comprehensive uncertainty analysis in measured and simulated data.
@inproceedings{seufferheld2025egu,
  title = {WaTEM/SEDEM's capability in simulating watershed-scale soil conservation: Using the GLUE approach to analyse the representation of in-field processes and connectivity features along thalwegs},
  author = {Seufferheld, K. D. and Batista, P. V. G. and Shokati, H. and Scholten, T. and Fiener, P.},
  booktitle = {EGU General Assembly 2025},
  year = {2025},
  address = {Vienna, Austria},
  month = apr,
  note = {27 April - 2 May 2025, EGU25-1799},
  doi = {10.5194/egusphere-egu25-1799},
}
2024
- EARSeL 2024
 Comparison of Hyperspectral and Multispectral Remote Sensing for Improved Surface Soil Moisture EstimationH. Shokati, M. Mashal, A. Noroozi, and 2 more authorsIn 13th EARSeL Workshop on Imaging Spectroscopy, Apr 2024
Surface Soil Moisture (SSM) is a crucial component of soil moisture, encompassing the water content in the top layer of soil. Although this near-surface soil layer contains only a small part of the total soil water storage, it plays a fundamental role in various hydrological, biochemical, physiological, and agricultural processes. Consequently, monitoring the spatial and temporal variability of SSM is an indispensable prerequisite for both mitigating and adapting to the effects of climate change. Conventional methods for estimating SSM are often point-based, and due to the spatial and temporal variability of SSM, extrapolating data from a single point to a larger area result in lower estimation accuracy. An alternative solution is therefore to use remote sensing technology to estimate SSM. The aim of this study was to evaluate the comparative potential of multispectral and hyperspectral remote sensing data for SSM estimation. To this end, a combination of data sources was used, including multispectral imagery from the Sentinel-2, Landsat 8, and Landsat 9 satellites, as well as data acquired by a hyperspectral camera called Spectrocam. The Spectrocam can perform spectroscopic analyses in the wavelength range from 339.6 to 1028.8 nm, offering a spectral resolution of 0.35 nm. In this study, the research farm of the University of Tehran in Iran with an area of 100 hectares was selected as the study area. The study area had a gentle slope and the land use consisted of bare soil, alfalfa, wheat, and maize. While the satellites passed over the study area, the Spectrocam was simultaneously mounted on a Matrice 100 unmanned aerial vehicle (UAV), which conducted aerial imaging spectroscopy over the region. The SSM modeling was carried out for the years 2021 to 2023 using the Random Forest (RF) algorithm. To validate the results, 45 soil samples were taken at each data collection phase. The results showed that the hyperspectral data from Spectrocam outperformed the multispectral data from Sentinel-2 and Landsat in estimating the SSM and had a significantly stronger correlation (R2 = 0.87). In contrast, the Landsat data showed superior performance with an R2 of 0.66 compared to the Sentinel-2 data, which only achieved an R2 of 0.49. The lower accuracy of the Sentinel-2 data can be attributed to the lack of a thermal band on this satellite. In addition, the results showed that the models developed in this study tended to overestimate SSM in regions with low moisture content and underestimate it in areas with high moisture content. This tendency is primarily related to the relatively large pixel size of the satellite, which leads to pixel non-uniformity and impurities. It is worth noting that the extent of overestimation and underestimation was less pronounced when using Spectrocam data compared to Sentinel-2 and Landsat. In the future, remote sensing technology will continue to play a significant role in the monitoring of SSM. Advances in hyperspectral cameras and satellite sensors, as well as the integration of UAVs, will improve the accuracy of SSM monitoring. This technology will become increasingly important in precision agriculture and climate change mitigation and adaptation. Addressing accuracy issues will be a focus of future research. It is also worth comparing Spectrocam with existing hyperspectral satellites such as EnMAP, PRISMA, and EMIT, as well as with upcoming missions such as CHIME and PRISMA-2, to make further progress in SSM estimation.
@inproceedings{shokati2024earsel, title = {Comparison of Hyperspectral and Multispectral Remote Sensing for Improved Surface Soil Moisture Estimation}, author = {Shokati, H. and Mashal, M. and Noroozi, A. and Abkar, A.A. and Scholten, T.}, booktitle = {13th EARSeL Workshop on Imaging Spectroscopy}, year = {2024}, address = {València, Spain}, } - EGU 2024
 Comparison of advanced multicriteria decision and FAO models for land suitability assessmentK. Nabiollahi, F. Molani, R. Taghizadeh, and 5 more authorsIn EGU General Assembly 2024, Apr 2024
Land suitability assessment is an important process in modern agricultural management, involving the evaluation of various factors such as soil properties, climate, relief, hydrology, crop varieties and socio-economic considerations. Various methods have been used to assess land suitability, such as the parametric method developed by Sys et al. (1991) and the FAO (1976) approach to land evaluation. Determining the relative weighting of the factors that influence land suitability is a particularly challenging step in the evaluation process. An alternative to these procedures is the use of multi-criteria decision making (MCDM) techniques, which enable land managers and policy makers to make informed decisions about land use and development. Spatial MCDM techniques include complex spatial data and methods such as the Technique of Preference Ordering by Similarity to the Ideal Solution (TOPSIS), which are widely used in the agricultural sector. TOPSIS determines the optimal alternative according to the principle of minimizing the proximity to the ideal solution and maximizing the distance to the negative ideal solution. The aim of this study was to assess the suitability of land for wheat cultivation in western Iran, a country facing the challenge of becoming self-sufficient in wheat. Seventy soil profiles were selected and described on the basis of a geomorphologic map and the content of various soil properties and wheat yield were determined. MCDM (TOPSIS) and FAO models were applied and evaluated according to wheat yield. The Shannon entropy method (SHE) was used to extract the criteria weights. Land suitability assessment was mapped using a Random Forest machine learning model and auxiliary variables. According to the results of the Shannon entropy method, slope, cation exchange capacity (CEC) and calcium carbonate equivalent (CCE) are the most important criteria for wheat cultivation. Furthermore, the results are also confirmed by the spatial autocorrelation between the key criteria and wheat yield. These results also show that the soil suitability values calculated with the TOPSIS model have a higher correlation with wheat yield than the values calculated with the FAO model (0.73 and 0.67, respectively). The spatial distribution of the suitability values for wheat cultivation showed that 30 to 33% of the areas were very suitable, 13-16% moderately suitable and 51% and 57% unsuitable. For the areas with high and medium suitability, the TOPSIS and FAO results were largely in agreement, in contrast to the areas with low suitability. This study provided a comprehensive approach to land suitability for wheat cultivation using advanced MCDM techniques and machine learning, which can be beneficial for sustainable land management and food security in Iran and similar regions.
@inproceedings{nabiollahi2024egu,
  title = {Comparison of advanced multicriteria decision and FAO models for land suitability assessment},
  author = {Nabiollahi, K. and Molani, F. and Taghizadeh, R. and Tahari-Mehrjardi, M. H. and Shokati, H. and Khosravani, P. and Kebonye, N. M. and Scholten, T.},
  booktitle = {EGU General Assembly 2024},
  year = {2024},
  address = {Vienna, Austria},
}
2019
- WCMSR 2019
 Determining the Number and Location of Tanks for Rainwater Harvesting Systems using Drone ImagesH. Shokati, M. Kouchakzadeh, and A.A. NorooziIn 9th National Conference on Watershed and Management of Water and Soil Resources, Apr 2019In Persian
The design of rainwater harvesting systems should be engineered. The designer must consider all aspects such as the optimal number of tanks and the best place to install them so that the system can be most profitable. In this paper, with the aim of determining the number and location of rainwater harvesting systems from impermeable surfaces such as roofs and streets, Tarbiat Modarres University College of Agriculture was considered as the study area. Imaging of the area was performed using the DJI Phantom 3 Professional drone and the Digital Elevation Map of the college was prepared using Agisoft.Photoscan software. Then, in order to determine the runoff direction, the basin of the case study was carried out in the Gis software and its stream networks were determined. Two scenarios were defined to determine the number and location of the tanks. The results showed that the number of tanks required in the first and second scenarios were 49 and 39, respectively. The results also showed that the total length of pipes required in the first and second scenarios were 2389 and 2693 meters, respectively.
@inproceedings{shokati2019tanks, title = {Determining the Number and Location of Tanks for Rainwater Harvesting Systems using Drone Images}, author = {Shokati, H. and Kouchakzadeh, M. and Noroozi, A.A.}, booktitle = {9th National Conference on Watershed and Management of Water and Soil Resources}, year = {2019}, note = {In Persian}, } - WCMSR 2019
 Design and Optimization of Rainwater Harvesting SystemsH. Shokati, M. Kouchakzadeh, and A.A. NorooziIn 9th National Conference on Watershed and Management of Water and Soil Resources, Apr 2019In Persian
During rainfalls, impermeable urban surfaces act as a barrier to water infiltration into the soil and cause surface runoff. Designing rainwater harvesting systems, in addition to reducing runoff and related damages, can reduce the pressure on water resources by providing some of the non-potable water needed. In this paper, with the aim of designing rainwater harvesting systems in a 4-storey building at Tarbiat Modares University, Faculty of Agriculture, daily precipitation data of the Chitgar Weather Station was prepared. The simulations were performed in Matlab software. Reliability percentage and overflow ratio were estimated for different tank volumes and finally, tank volume optimization was performed using Genetic Algorithm. The results showed that due to the high daily volume of water demand in this building, the rainwater harvesting system is less reliable and a small percentage of days of the year can meet the non-potable needs of residents. High domestic demand has also caused the tanks to overflow very little. The results also showed that the optimum volume of the tank in this building is one cubic meter and with using this tank, about 170 cubic meters of rainwater can be saved and used annually.
@inproceedings{shokati2019design, title = {Design and Optimization of Rainwater Harvesting Systems}, author = {Shokati, H. and Kouchakzadeh, M. and Noroozi, A.A.}, booktitle = {9th National Conference on Watershed and Management of Water and Soil Resources}, year = {2019}, note = {In Persian}, } - NCRCS 2019
 Assessing performance of rainwater harvesting systems in KarajH. Shokati, M. Kouchakzadeh, A.A. Noroozi, and 1 more authorIn 7th National Conference on rainwater catchment systems, Apr 2019In Persian
Performance assessment of rainwater harvesting systems implemented in Karaj region.
@inproceedings{shokati2019karaj,
  title = {Assessing performance of rainwater harvesting systems in Karaj},
  author = {Shokati, H. and Kouchakzadeh, M. and Noroozi, A.A. and Osouli, S.},
  booktitle = {7th National Conference on rainwater catchment systems},
  year = {2019},
  note = {In Persian},
}